
Re: Global Warming
Inviato da Nirav il 21/5/2009 22:03:10
Un estratto dal sito www.asinglevoice.us
The graph below shows temperatures over the past 400,000 years as measured from the Vostok ice core samples.
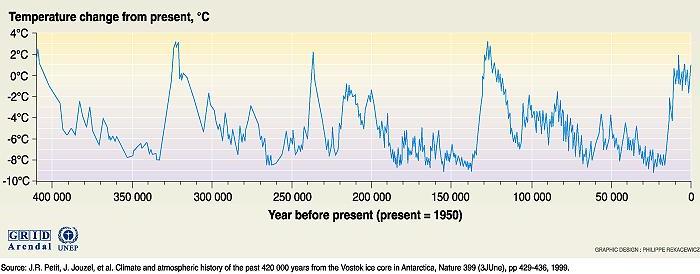
A couple of points jump out at anyone looking at the graph above. One point is that temperature swings have been occurring since long before mankind came into existence. Another point is that the temperature of the earth has been warmer than it is today, and that these periods of cooler and warmer temperature appear to be somewhat cyclical with less severe changes in temperature existing between the larger changes. We can also see that we are indeed coming out of one of the more severe ice ages (far right of the graph). In other words, we are living during a period when the earth is naturally getting warmer. One last point shown in the graph above is that climate change is not gradual. Notice how fast both the ice ages and warmer periods end. The end of an ice age is shown as a very sharp rise in temperature and the beginning of an ice age is shown as an almost equally sharp decrease in temperature. And remember, all of this is without any influence by mankind.
Examining the above excerpt more carefully reveals something astonishing; the earth is still 4°C cooler than it was before the last ice age began 130,000 years ago. So we have 4°C to go just to get back to where the earth was naturally before the last ice age, before mankind could have affected the environment in any way. It also reveals that the sea levels dropped up to 130 meters below its current level. Since we know we will probably warm up at least 4°C, it stands to reason that we should also expect sea levels to continue to rise. All of this was, and is, the result of natural occurrences.
Let's get even closer to our current day by looking at the graph below that shows just the last 2000 years, before the industrial revolution that so many are attempting to blame for our current warming climate.
Example of regional variations in surface air temperature for the last 1000 years, estimated from a variety of sources, including temperature-sensitive tree growth indices and written records of various kinds, largely from western Europe and eastern North America. Shown are changes in regional temperature in° C, from the baseline value for 1900. Compiled by R. S. Bradley and J. A. Eddy based on J. T. Houghton et al., Climate Change: The IPCC Assessment, Cambridge UniversityPress, Cambridge, 1990 and published in EarthQuest, vol 5, no 1, 1991.
(http://gcrio.org/CONSEQUENCES/winter96/article1-fig1.html)
Again, as shown in the graph above, it can be seen that the temperature was warmer during the 1200's, without our industrial revolution, than temperatures today.
The graph below shows temperature differences over the last 2400 years and highlights that temperatures have been higher during the rise of Rome and during the times when cathedrals were being constructed than temperatures are today.
Grafico tratto da:
Ice Ages and Astronomical Causes: Data, Spectral Analysis, and Mechanisms by Richard A. Muller (Author), Gordon J. Macdonald (Author)
The purpose of the above graphs is to show that the natural temperature swings of the earth are somewhat cyclical and occur without any influence by mankind. They also show that in just the recent history of 2400 years, the earth's temperature has been fluctuating, including periods that were warmer than it is today. In other words, the warming of the environment that we are experiencing is not only natural, but expected! And Global Warming is definitely and indisputably not man made
Visto che la scienza dimostra che le ere glaciali e il riscaldamento globale sono eventi naturali, quali sono le basi per la odierna controversia?
The graph below shows temperatures over the past 400,000 years as measured from the Vostok ice core samples.
A couple of points jump out at anyone looking at the graph above. One point is that temperature swings have been occurring since long before mankind came into existence. Another point is that the temperature of the earth has been warmer than it is today, and that these periods of cooler and warmer temperature appear to be somewhat cyclical with less severe changes in temperature existing between the larger changes. We can also see that we are indeed coming out of one of the more severe ice ages (far right of the graph). In other words, we are living during a period when the earth is naturally getting warmer. One last point shown in the graph above is that climate change is not gradual. Notice how fast both the ice ages and warmer periods end. The end of an ice age is shown as a very sharp rise in temperature and the beginning of an ice age is shown as an almost equally sharp decrease in temperature. And remember, all of this is without any influence by mankind.
Examining the above excerpt more carefully reveals something astonishing; the earth is still 4°C cooler than it was before the last ice age began 130,000 years ago. So we have 4°C to go just to get back to where the earth was naturally before the last ice age, before mankind could have affected the environment in any way. It also reveals that the sea levels dropped up to 130 meters below its current level. Since we know we will probably warm up at least 4°C, it stands to reason that we should also expect sea levels to continue to rise. All of this was, and is, the result of natural occurrences.
Let's get even closer to our current day by looking at the graph below that shows just the last 2000 years, before the industrial revolution that so many are attempting to blame for our current warming climate.
Example of regional variations in surface air temperature for the last 1000 years, estimated from a variety of sources, including temperature-sensitive tree growth indices and written records of various kinds, largely from western Europe and eastern North America. Shown are changes in regional temperature in° C, from the baseline value for 1900. Compiled by R. S. Bradley and J. A. Eddy based on J. T. Houghton et al., Climate Change: The IPCC Assessment, Cambridge UniversityPress, Cambridge, 1990 and published in EarthQuest, vol 5, no 1, 1991.
(http://gcrio.org/CONSEQUENCES/winter96/article1-fig1.html)
Again, as shown in the graph above, it can be seen that the temperature was warmer during the 1200's, without our industrial revolution, than temperatures today.
The graph below shows temperature differences over the last 2400 years and highlights that temperatures have been higher during the rise of Rome and during the times when cathedrals were being constructed than temperatures are today.
Grafico tratto da:
Ice Ages and Astronomical Causes: Data, Spectral Analysis, and Mechanisms by Richard A. Muller (Author), Gordon J. Macdonald (Author)
The purpose of the above graphs is to show that the natural temperature swings of the earth are somewhat cyclical and occur without any influence by mankind. They also show that in just the recent history of 2400 years, the earth's temperature has been fluctuating, including periods that were warmer than it is today. In other words, the warming of the environment that we are experiencing is not only natural, but expected! And Global Warming is definitely and indisputably not man made
Visto che la scienza dimostra che le ere glaciali e il riscaldamento globale sono eventi naturali, quali sono le basi per la odierna controversia?
Messaggio orinale: https://old.luogocomune.net/site/newbb/viewtopic.php?forum=6&topic_id=4998&post_id=138675